
 by TrueData
When time is the wrong clock: Range, Volume and Delta bars
Understand what non-time candles change, when they clarify participation, and how to avoid forcing them into a time-based framework.
FutPrint by TrueData · Published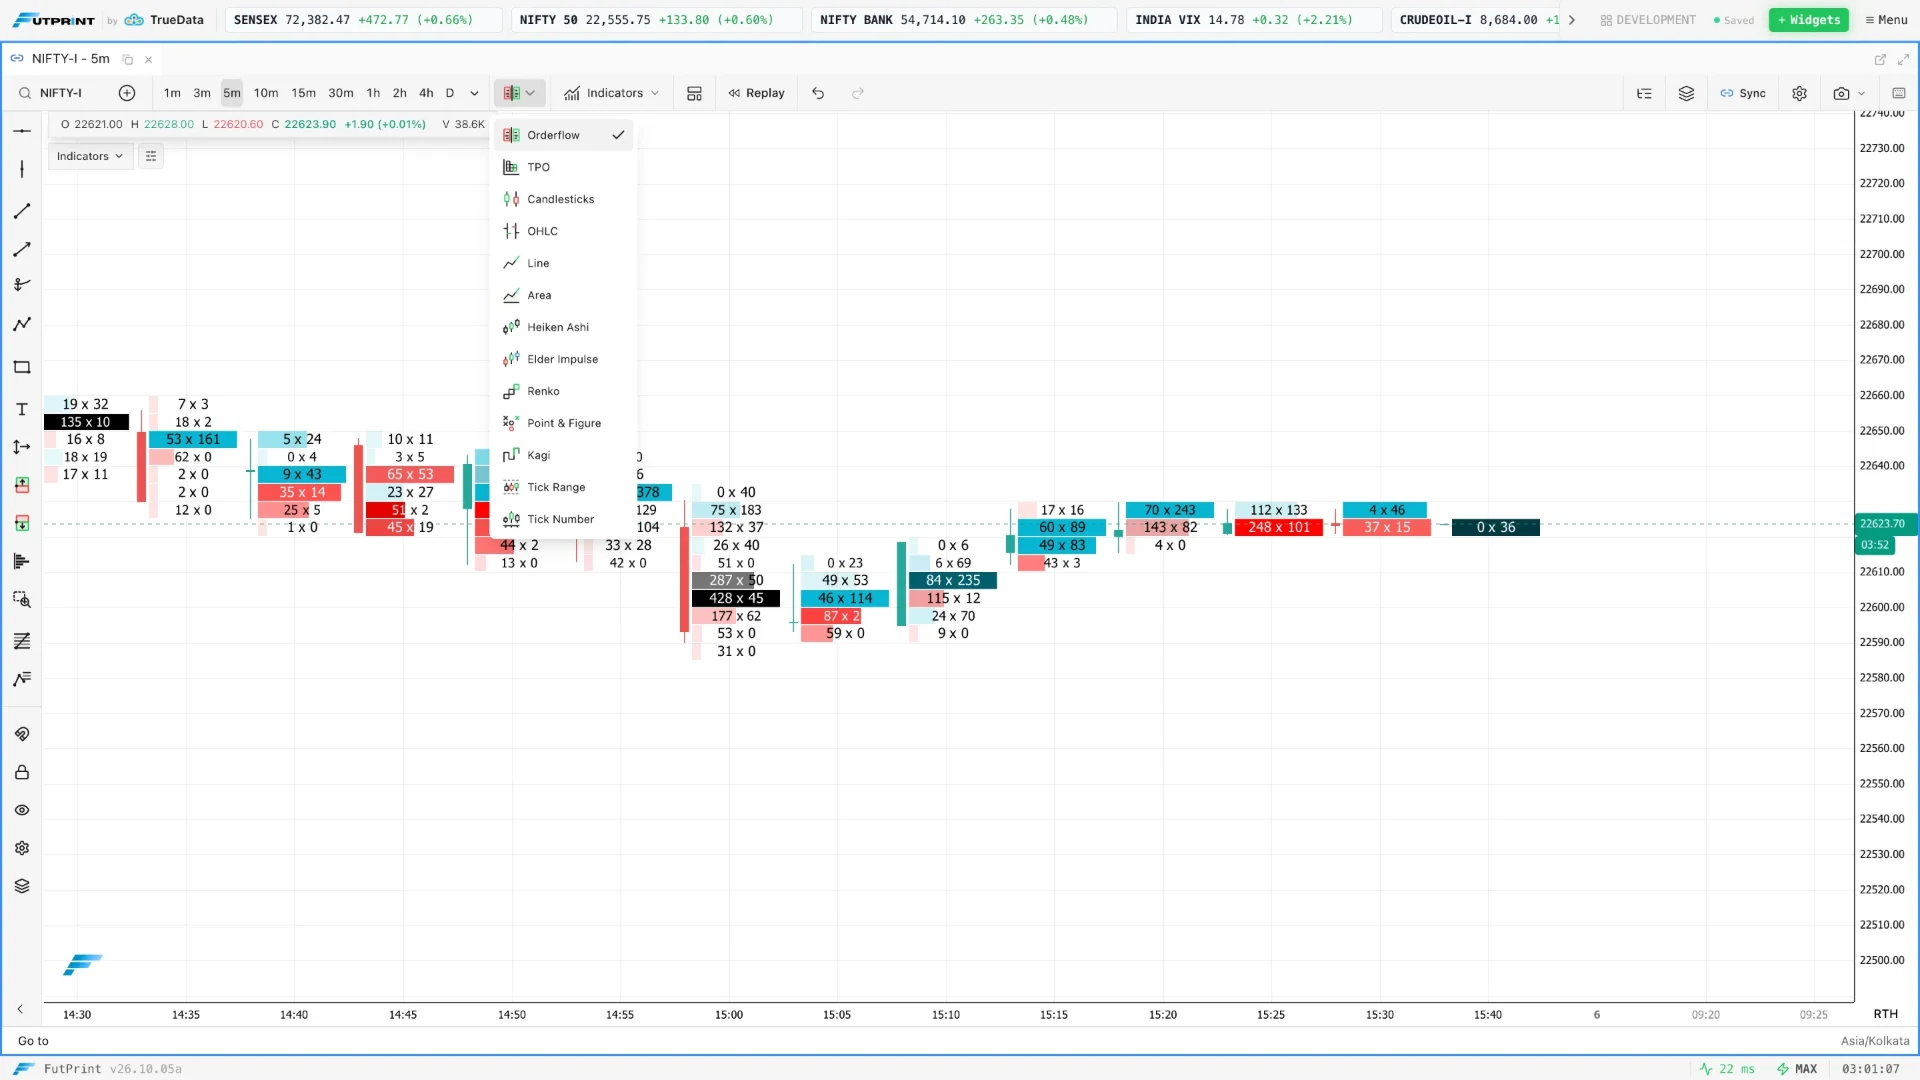
Change the clock, change the picture
A time candle closes when its interval ends. A non-time candle closes when another construction rule is satisfied. That rule might count reported trades, accumulate volume or measure a price range. The same transaction stream can therefore produce very different-looking charts without any contradiction. Each chart chooses a different unit for organising the history.
This is useful when elapsed time is not the main thing you want to compare. A five-minute interval can contain a frantic opening burst or almost no activity. An event-based chart allocates more bars to periods that satisfy its event rule more frequently. It redistributes visual attention rather than automatically improving the data.
The first step is to name the construction precisely. Tick count, traded volume and price range are distinct. A platform label containing the word tick does not necessarily mean the same thing as another platform's label. This guide separates the concepts and shows how to compare them without assuming one is universally superior.
A trade-count bar counts transactions, not contracts
On a count-based chart, a bar closes after a specified number of reported trades. With a setting of 200, the construction groups 200 qualifying trade records into a bar. One record may contain a small size and another a large size. Their contribution to the count is the same, although their contribution to volume differs.
Imagine two sets of 200 transactions. The first averages one contract per trade and the second averages ten. Both produce one count-based bar, but their volumes differ substantially. This is why calling a tick-count chart a volume chart is misleading. Transaction frequency and traded quantity answer different questions.
The feed's handling of trades also matters. If records are combined or split differently, bar boundaries can differ across providers. Record the data source when reviewing examples. A 200-tick chart is not a universal object independent of reporting conventions; it is a construction built from a particular stream. FutPrint is a case in point: its feed carries one row for each second that traded rather than one for each trade, so it does not offer a trade-count bar. Counting its rows would count seconds.
Range bars respond to price movement
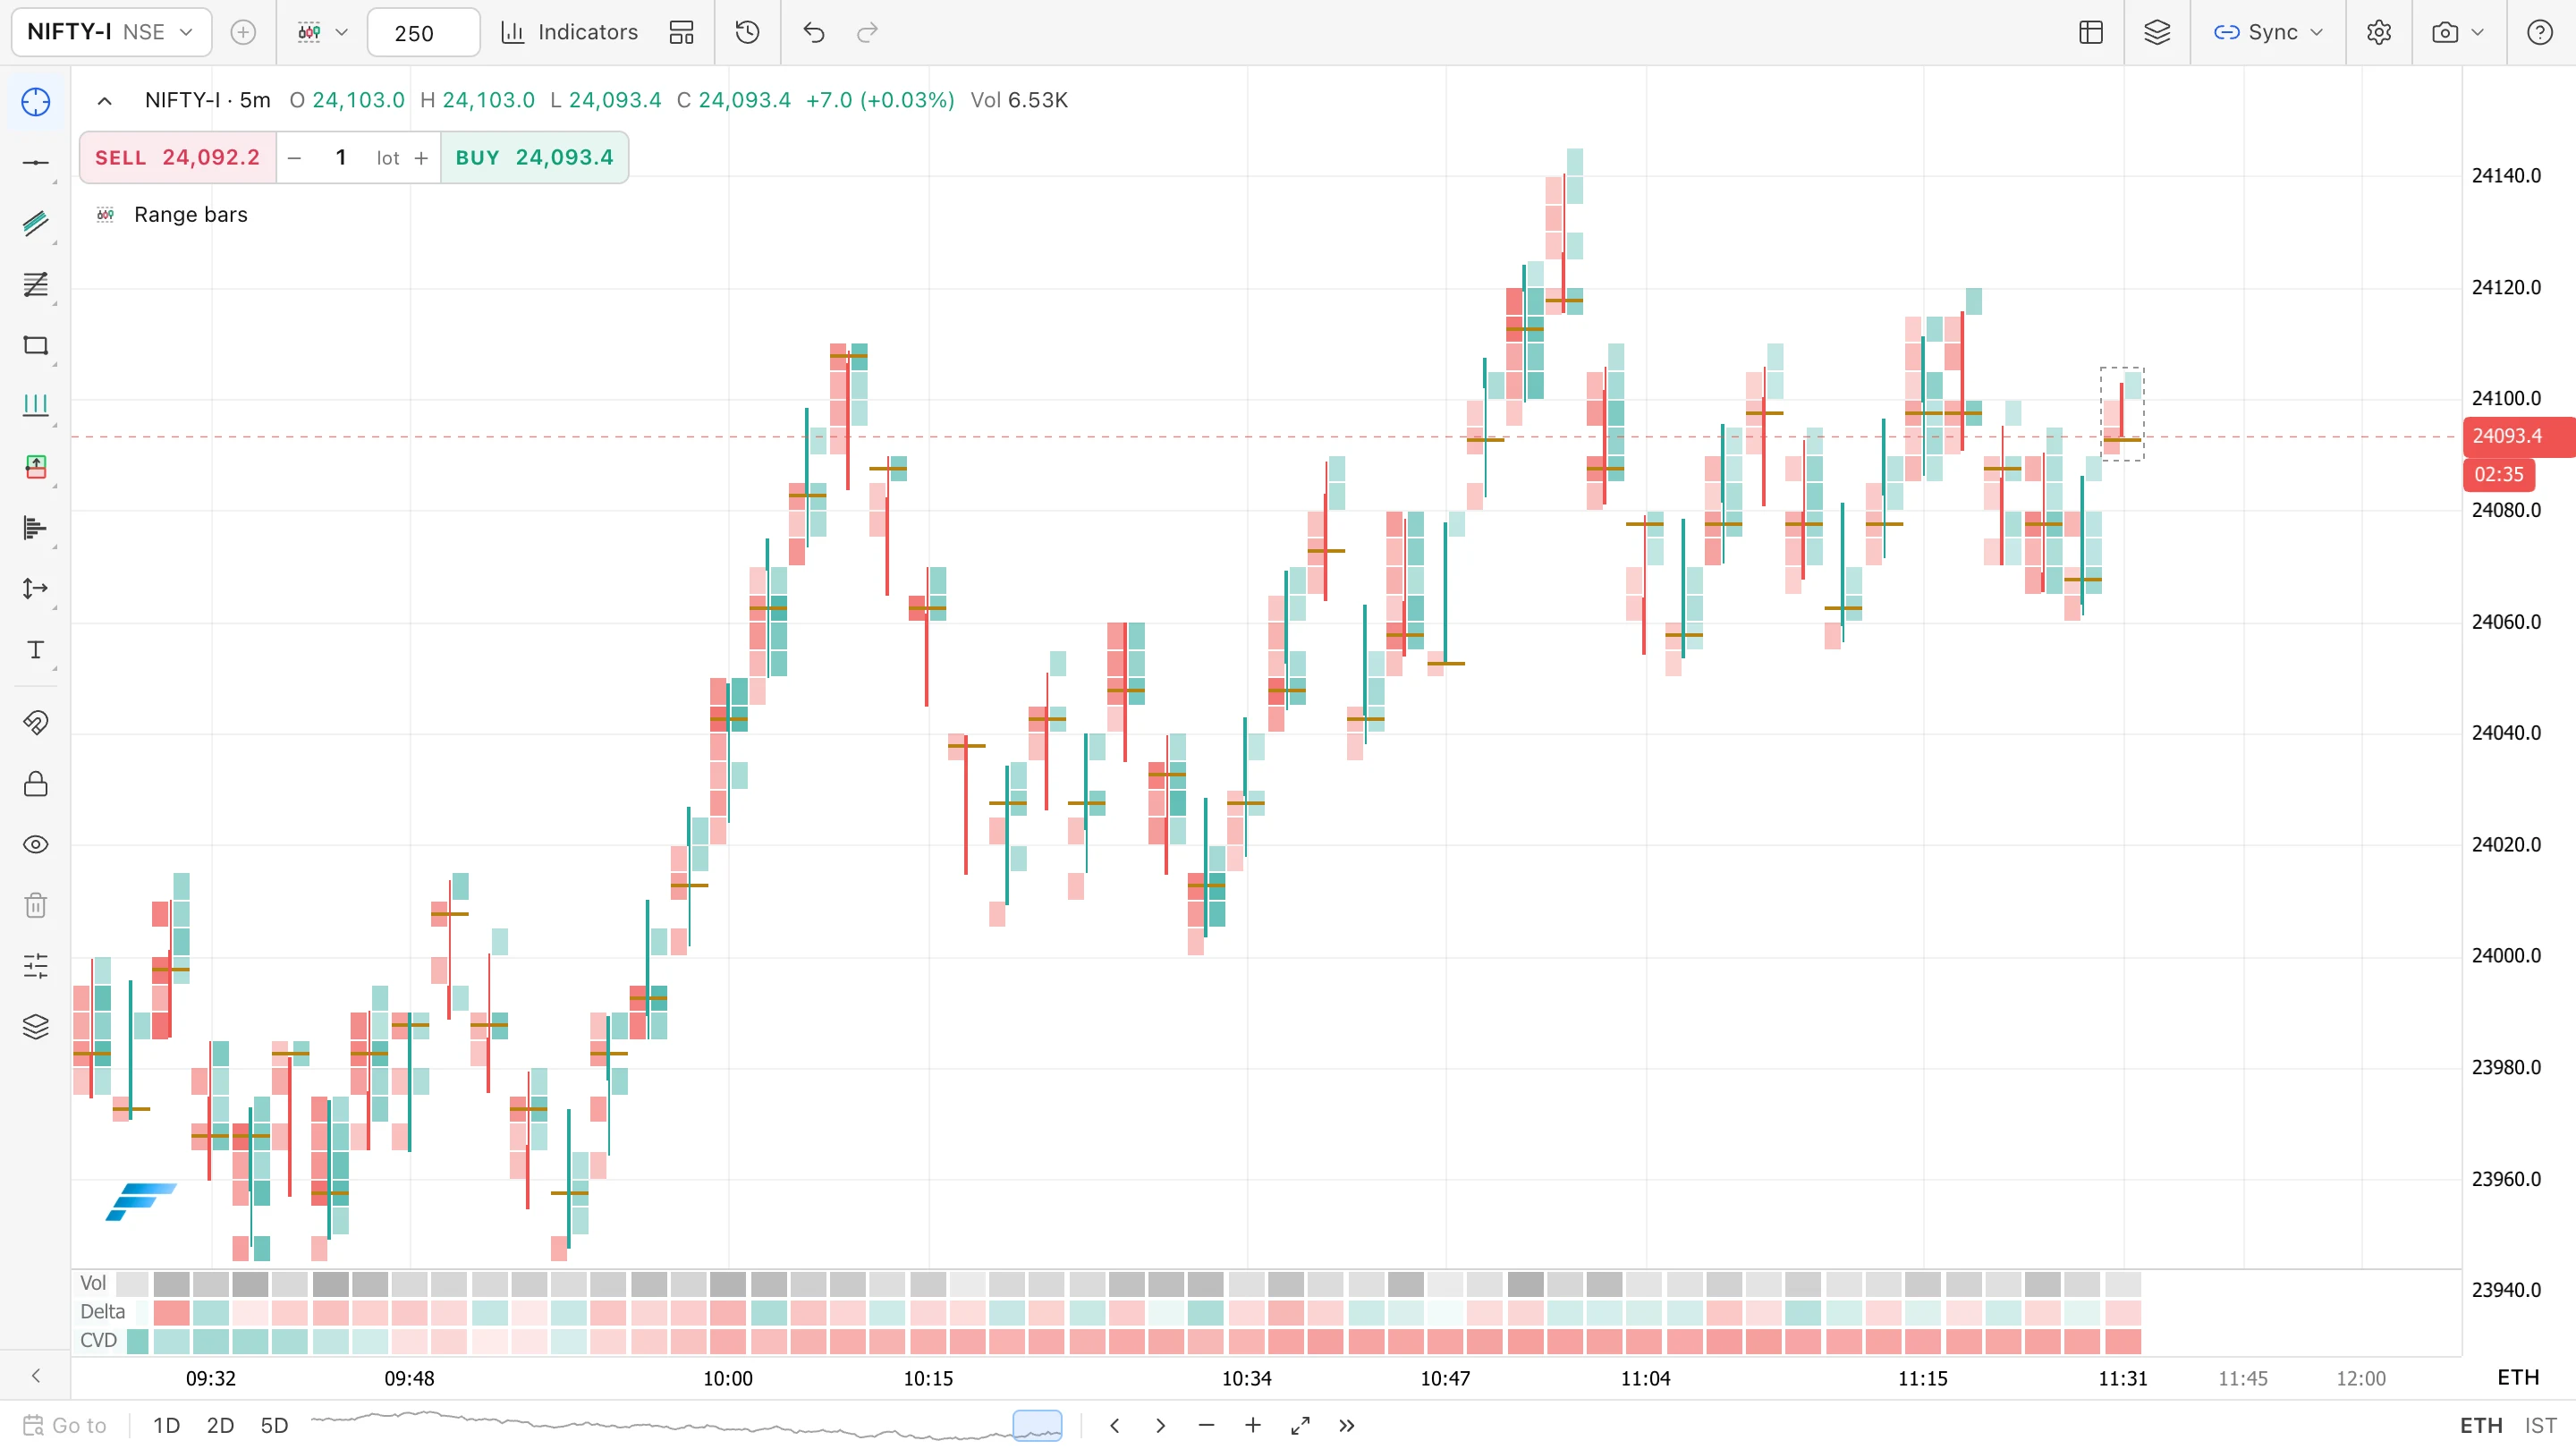
A range-based bar is built around a chosen price distance. Exact rules vary: platforms may differ in how they handle the opening price, the final tick, gaps and boundary crossings. Understand the documented implementation before assuming every visible bar must have identical geometry under all conditions.
Suppose the instrument's minimum price increment is 0.05 and your range is ten increments. The intended distance is 0.50 in price units. Entering ten points instead would be a radically different setting. Confirm whether the control accepts ticks, points or another unit, especially when switching instruments.
Range bars may compress prolonged activity within a narrow area because the price threshold has not been met. That does not mean the period lacked volume or significance. A long pause can contain considerable exchange of positions. Keep time and volume visible somewhere if their absence would change your interpretation.
Volume bars are a separate construction
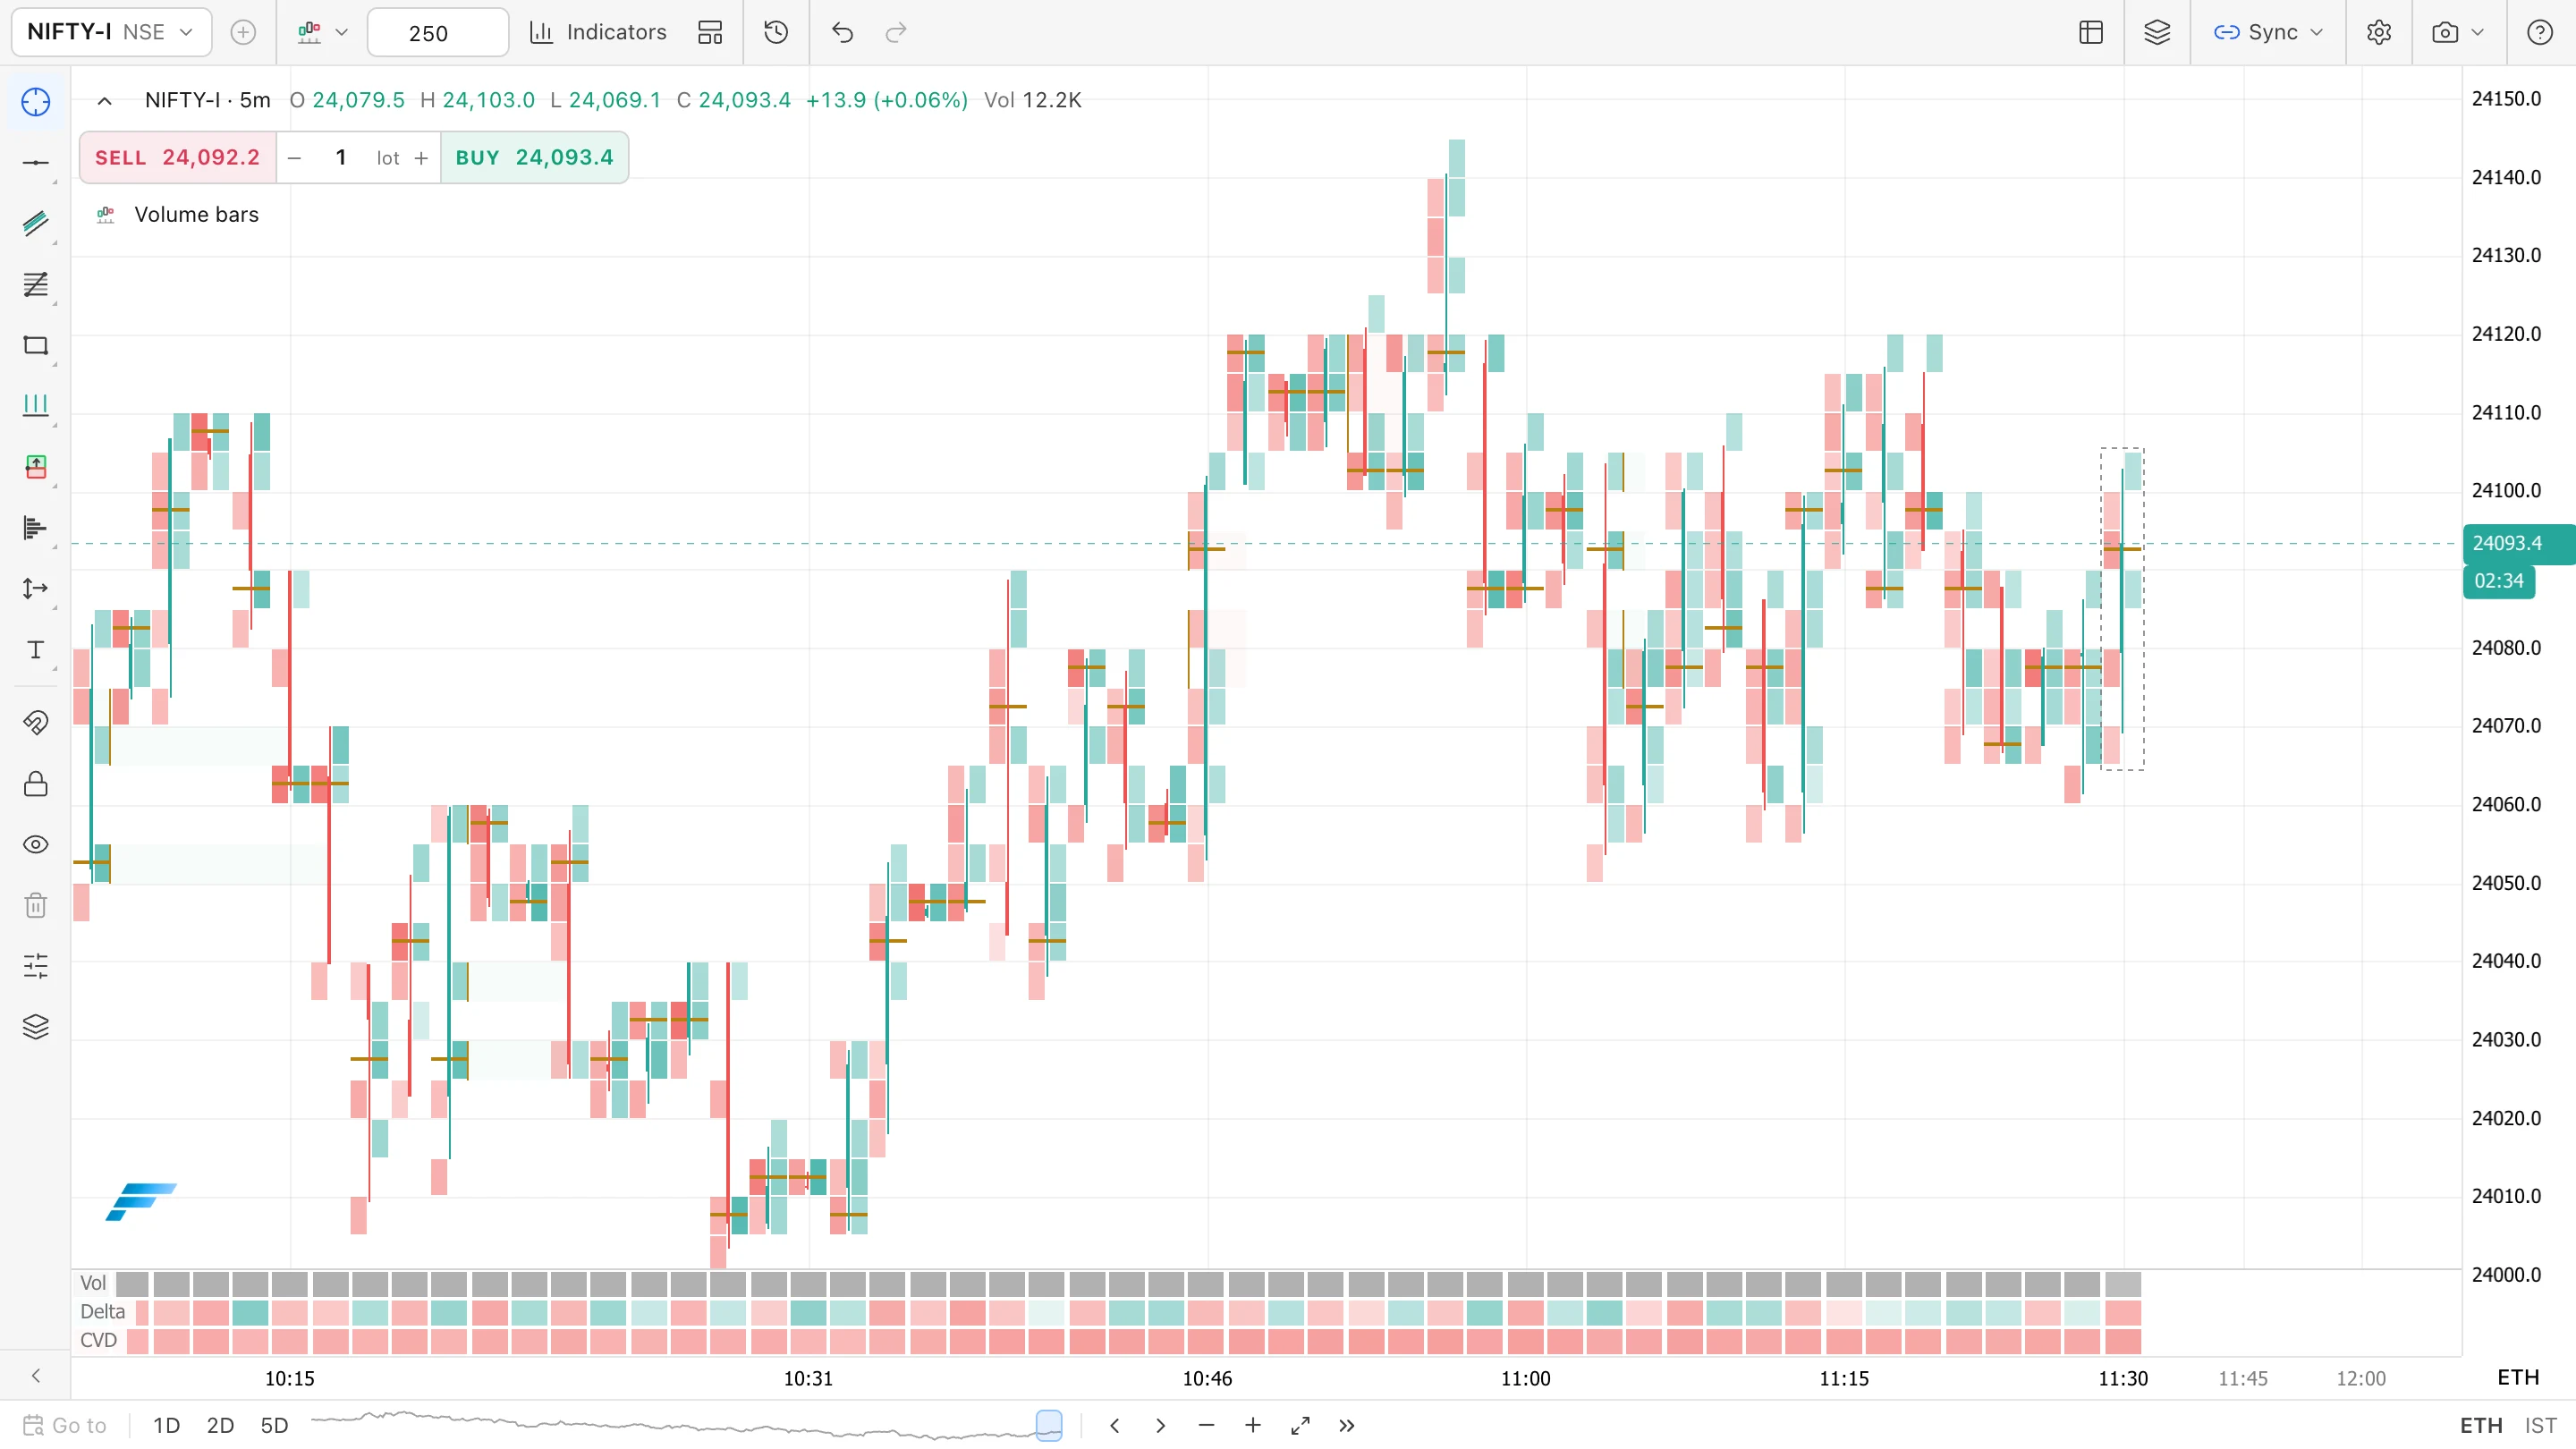
A volume bar closes after a target amount of traded quantity has accumulated, subject to the implementation's handling of a trade that crosses the threshold. If the target is 1,000 contracts, ten large trades or hundreds of small trades could complete the bar. That is different from counting a fixed number of trades.
Some tools split an oversized transaction across bars, while others keep it intact and permit an overshoot. Those choices affect bar boundaries and should be documented if you compare platforms or backtests. The label alone does not tell you how the stream was partitioned.
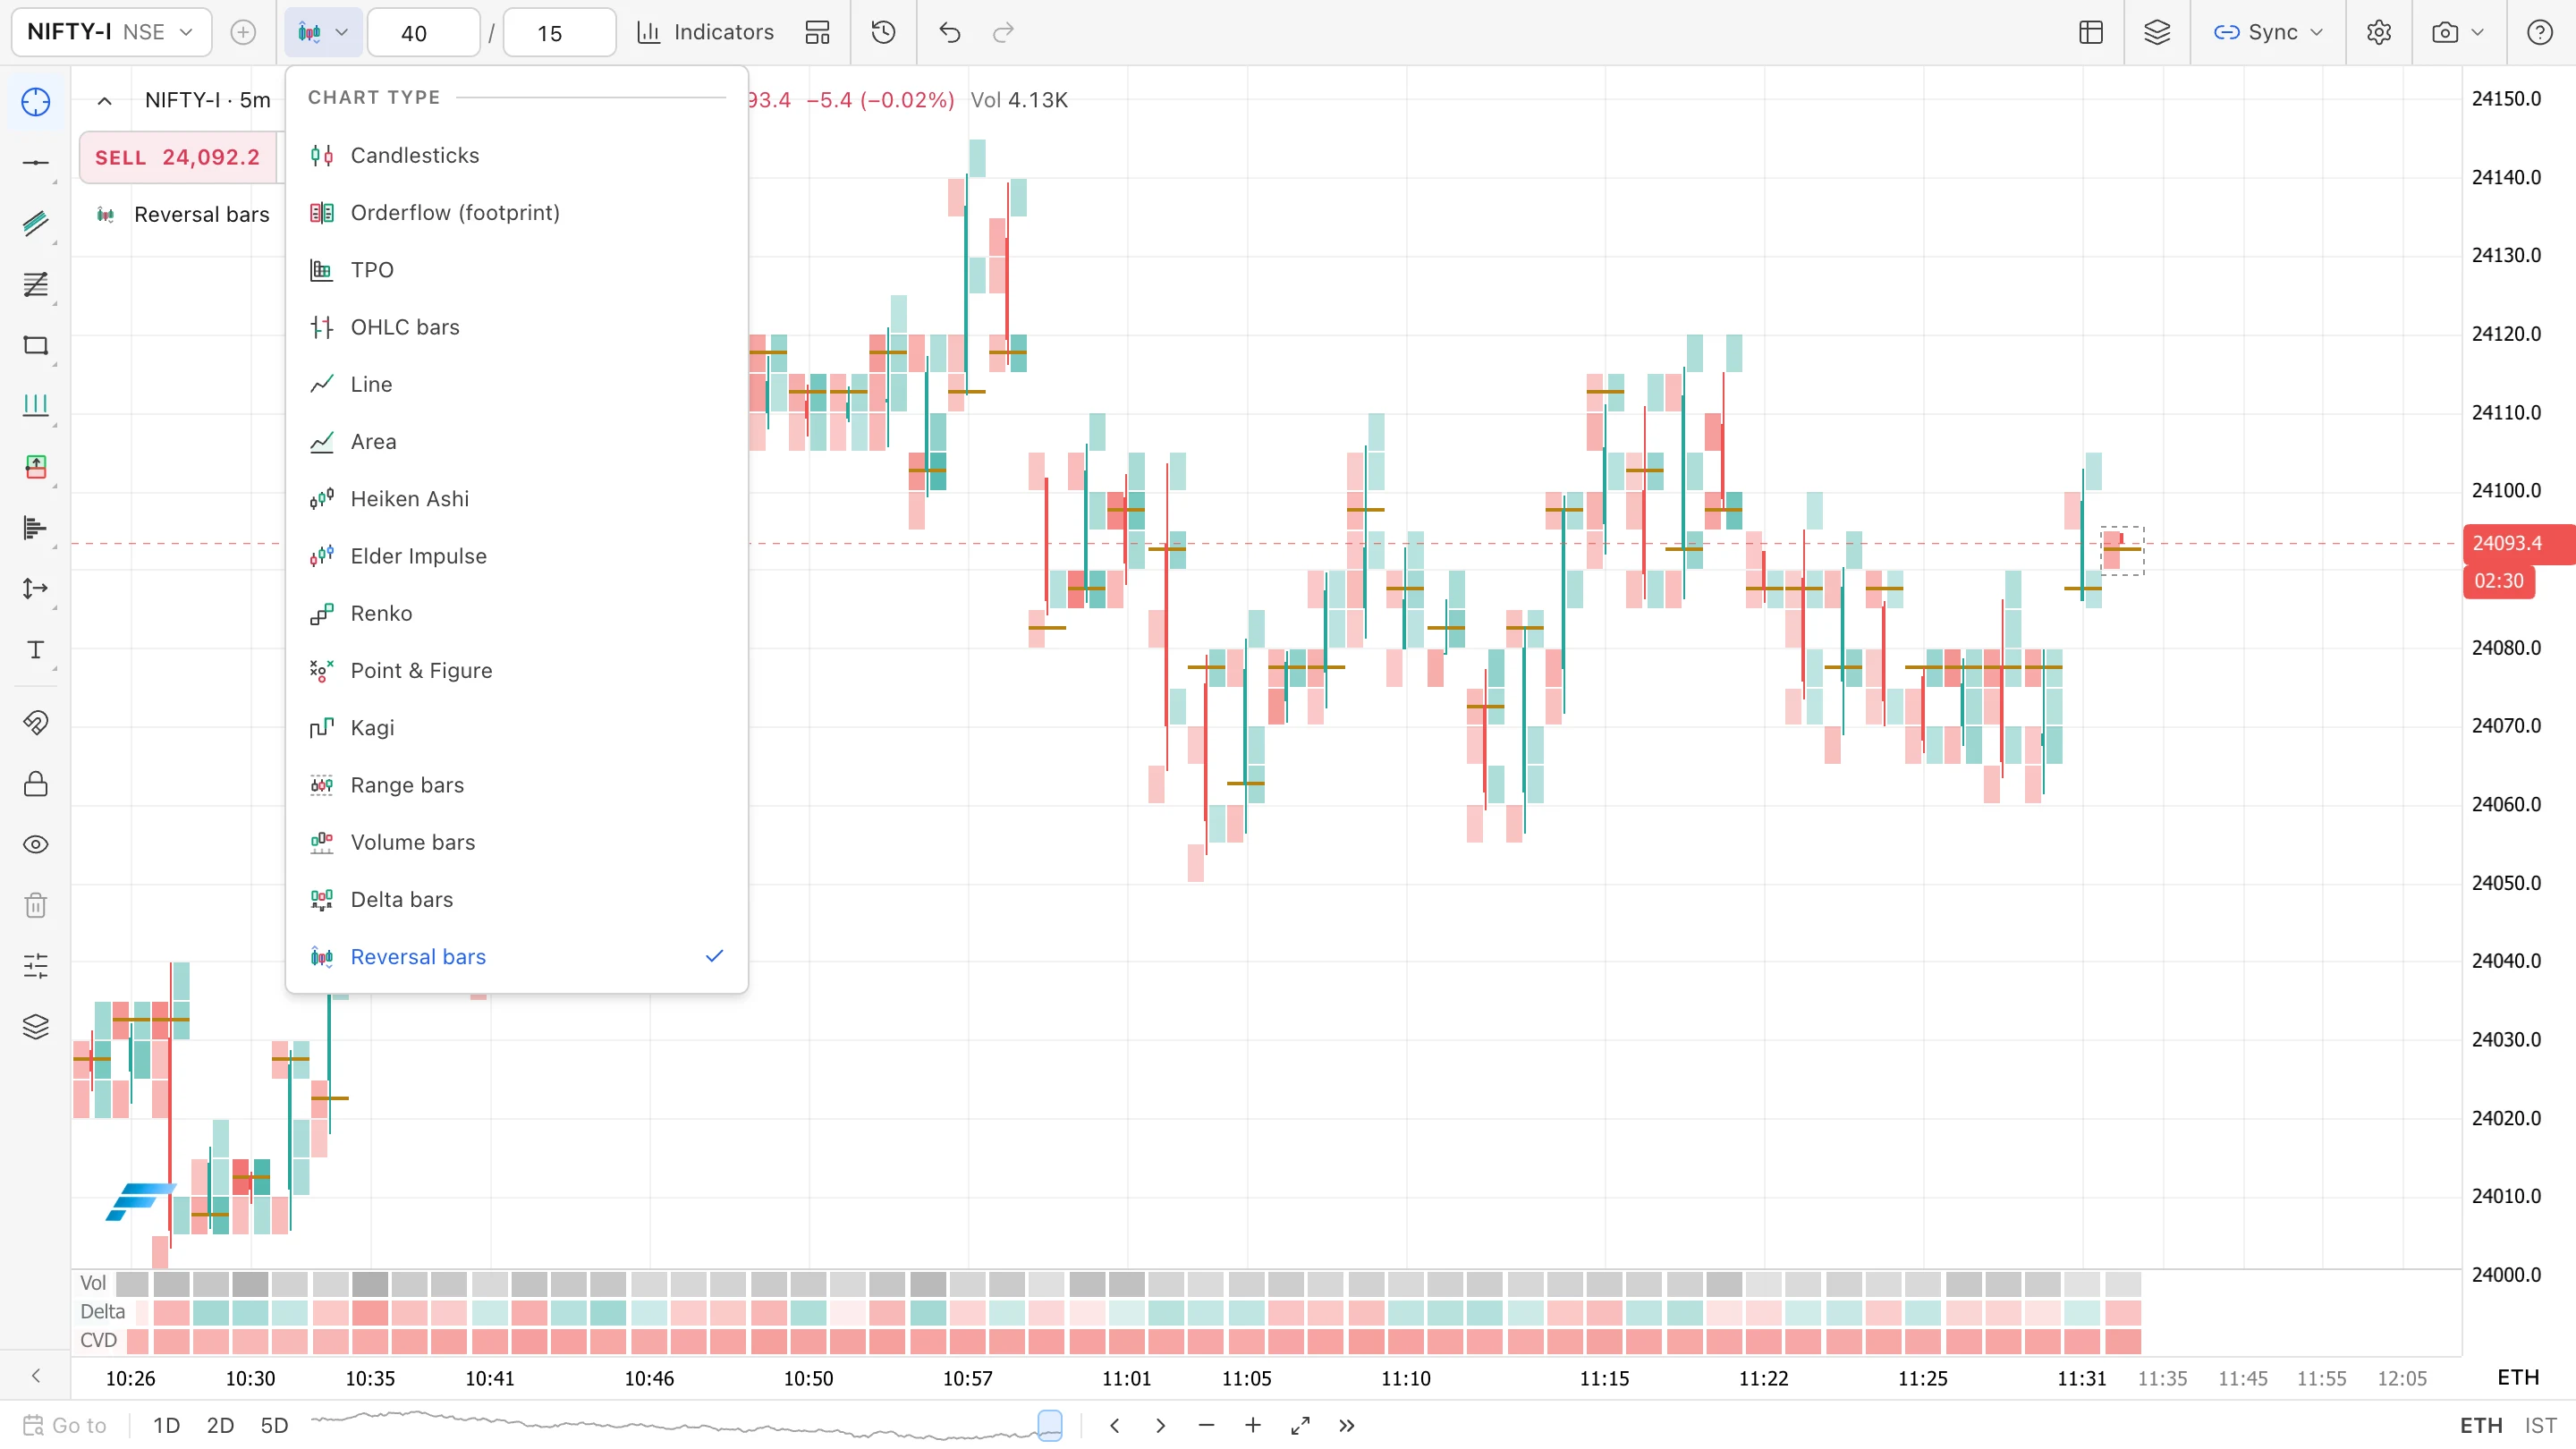
FutPrint builds four of these constructions: Range, Volume, Delta and Reversal bars. Its Volume bars split a second of trading that crosses the target, so every bar holds the same volume; Delta bars close when buying and selling are a set number of lots apart, and Reversal bars close on a pullback after a run. When requesting a capture or following a tutorial, use the name shown in the application.
A numerical example of changing bar speed
Consider a volume bar of 500 lots. During one minute, 2,500 lots trade, producing approximately five completed bars depending on the starting partial bar. During another minute, only a hundred trade, so the same bar may remain unfinished for several minutes. Horizontal spacing on the chart can conceal this large difference in elapsed time.
Now imagine a range setting of one point. Price oscillates within half a point for ten minutes while many trades occur. A volume chart can produce many bars, while the range chart may show little completed-bar progression. When price then travels several points quickly, the range view becomes much busier.
Neither display is lying. They allocate space according to different rules. The mistake would be to interpret equal horizontal distance as equal time or equal traded quantity without checking the construction. A chart's visual rhythm only becomes meaningful once you understand what completes its bars.
Selecting an initial setting
Choose a setting from the observation task, not from a screenshot that looked profitable. For a broad session study, you may want relatively few bars with readable swings. For a detailed execution study, you may want more resolution. Begin with one liquid instrument and inspect several ordinary sessions before settling on a scale.
Try a small set of deliberately spaced settings, such as a base size and a multiple of that size. FutPrint opens Volume, Delta and Reversal bars at a size it works out from the symbol's recent trading; treat that as a starting point, not a recommendation. Compare what changes: bar duration, visible swings, number of apparent signals and readability during quiet periods. Avoid searching hundreds of settings for the one that best describes yesterday's winning move.
Record the selected setting before evaluating outcomes. If every failed example causes another adjustment, you are adapting the measurement to the answer. A stable setting does not need to work equally well in all conditions, but you should understand where it becomes too coarse or too busy.

Indicators now measure events instead of minutes
A twenty-bar moving average on a one-minute chart looks back over roughly twenty minutes of completed bars. On a volume chart, twenty bars cover a variable duration. During an active period they may represent a short interval; during a quiet period they may reach much further into the past.
That change affects interpretation. A moving-average crossover may appear more responsive because bars form faster, not because the indicator has gained predictive power. An oscillator calculated over a fixed number of range bars also reflects a different sampling rule from the same oscillator on time candles.
Keep session-based tools anchored to their intended definition. If an indicator depends on session boundaries, confirm those boundaries remain consistent after changing modes. Do not assume that every study has the same meaning merely because its settings panel still shows the same numeric lookback.
Non-time bars can hide waiting and gaps
A compressed quiet period can be helpful visually, but waiting is part of trading. A setup that looks immediate on a volume chart may have required a long period of exposure, attention or uncertainty. Include timestamps in the review so the exercise does not accidentally remove the psychological and operational costs of waiting.
Gaps deserve similar care. If price jumps between reported trades, an algorithm may represent that movement in a particular way, but the display does not prove execution was possible at every intermediate level. Synthetic bar boundaries should not be treated as guaranteed fills.
This matters especially in backtesting. Entry and exit assumptions must refer to executable data, not merely aesthetically complete bars. If the available history lacks the intrabar sequence required to evaluate a rule, record that limitation instead of filling in a convenient path through the candle.
Compare a setup on two clocks
Choose a predefined event, such as the first return to an opening range boundary. Open a time chart for context and an event-based chart for detail. Mark the same timestamp in both. Write the observation from each view before deciding whether the second chart has added anything useful.
The time chart may show that the return occurred late in the session after a long pause. The Volume bars may show where the business was done more evenly. The Range bars may make the local price rotations easier to distinguish. These contributions are different; none should erase the others.
If the event looks compelling only after changing the scale repeatedly, keep that fact in the journal. The purpose of comparison is to understand sensitivity. A robust observation should be explainable in the underlying transactions or prices, even if one presentation makes it easier to see.
A FutPrint setup sequence
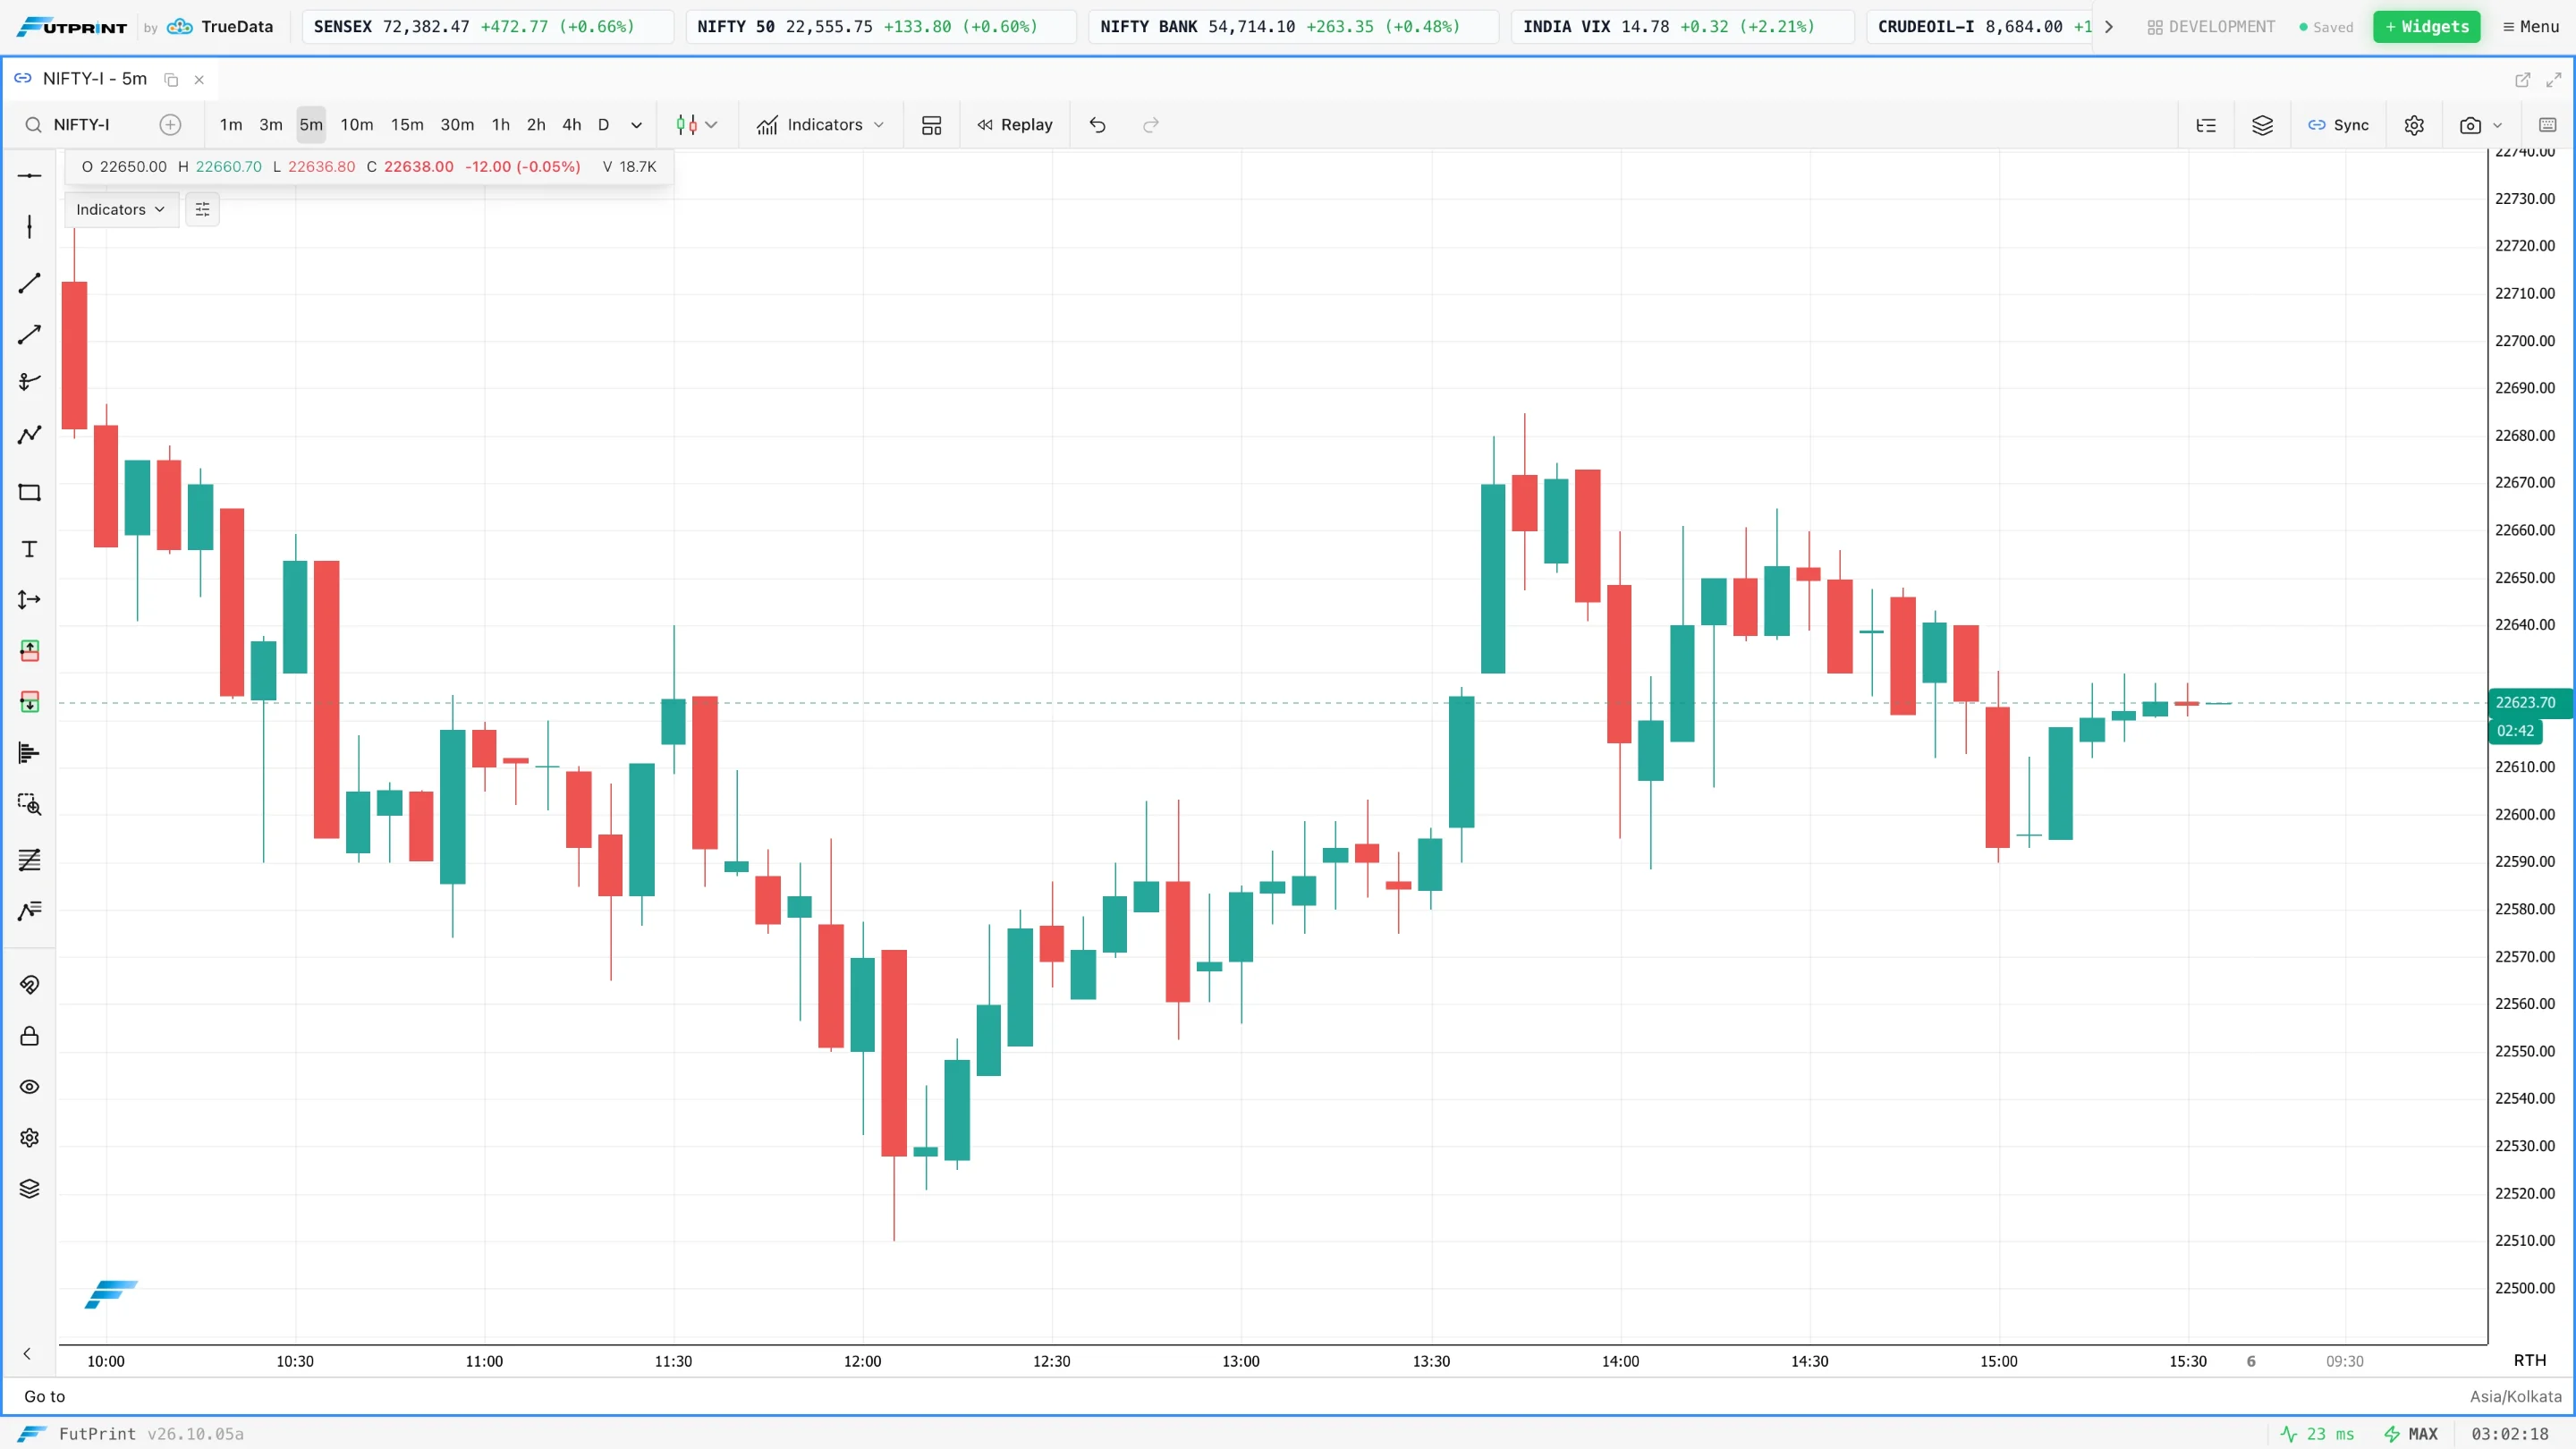
In the chart toolbar, open Chart type and pick Range, Volume, Delta or Reversal bars. Check the size field beside it and confirm its units: ticks for Range and Reversal bars, lots for Volume and Delta bars. Keep a second chart on a familiar time interval so you can compare the same instrument and session. These bars are built from the raw trade history of the Max plan.
Before a serious study, verify that enough history has loaded. The first visible event bar may be partial or depend on where the data starts. If you reload, compare the construction at a known timestamp rather than assuming every bar boundary must be unchanged under every loading condition.
Save the workspace with a name that includes its purpose. "Index volume-bar review" is more useful than "best setup." In the journal, record the contract, session, mode, setting, feed timing and any indicators used. Those details make a future comparison reproducible.
Common errors to remove from the process
- Treating a trade count as the number of contracts traded.
- Assuming Range bars and Volume bars are interchangeable.
- Comparing indicator periods without considering their changing time coverage.
- Reading empty horizontal space as inactivity when the chart compresses time.
- Assuming synthetic boundaries represent executable prices during a gap.
- Choosing a parameter because it makes one past trade look obvious.
An additional error is removing the reference chart too early. Event-based bars can be an excellent detailed view, but they do not automatically carry calendar context, session rhythm or the relationship to broader levels. Keep those references available until the new construction has a clearly defined job in the workflow.
Practice exercise and review questions
Select five consecutive sessions and one fixed event-bar setting. For each day, record the number of bars in a chosen thirty-minute window, the longest approximate bar duration and the main price rotation. Compare those observations with the corresponding time chart. Include both quiet and active windows rather than selecting only clean trends.
Next, repeat with one alternative setting chosen in advance. Ask whether the change improves readability or simply produces more apparent turning points. Record examples where the original setting was clearer as well as examples where the alternative helped. This prevents novelty from being mistaken for improvement.
At the end, define when you will use the event-based view and when you will return to time candles. The best result is a specific role, such as inspecting transaction activity around a known level. A different clock can reveal useful detail, but disciplined comparison is what makes that detail usable.
Questions to resolve before comparing results
What happens at a session boundary?
Check whether a partially formed bar carries across the boundary or restarts. The answer affects the opening bar and every subsequent grouping. Two charts using the same nominal size can differ if one starts counting at the session open while another continues an earlier sequence. FutPrint closes the bar open at the end of a trading day as it stands and starts a new one with the next day's first trade. Preserve the reset rule with your template and do not assume that matching the number alone reproduces the chart.
Can I compare bar counts across instruments?
Only with a clear definition of what the comparison means. A hundred event-based bars in two instruments does not imply equal elapsed time, equal volume or equal monetary exposure. Different trade sizes and reporting conventions can produce different counts. Compare an instrument with its own consistent history first, and retain actual timestamps when making broader comparisons.
Why can historical and live bars look different?
Data granularity, reconstruction rules and corrections can affect event-based construction. A history assembled from aggregated bars may not retain the exact transaction order required to reproduce a live event-based chart. FutPrint builds the bars it loads and the bars it streams from the same feed with one set of rules. If the platform indicates that a mode is unavailable or has limited history, respect that boundary. Do not use an approximate reconstruction to make claims about the precise order of trades.
What belongs in a saved example?
Include the symbol, contract, date, construction type, parameter, reset convention and visible time span. Add a matching time chart when the example concerns tempo. This makes the image useful to someone who was not present during the exercise and prevents a visually neat sequence from being mistaken for a complete account of the session.